
Data-driven HR is an excellent tool to increase productivity. According to a Gartner research, around 78% of HR professionals say that their organizations rely heavily on data to make decisions. To consolidate all the data, organizations also need HR dashboards.
This guide explains HR analytics and dashboards, core metrics, how to build your first dashboard, and more.
30-Second Summary
- HR dashboards visualize important metrics and simplify complex data.
- HR analytics turns workforce data into actionable insights. They help organizations make better, data-driven decisions.
- The real value comes from aligning your organization’s metrics with business goals, not just tracking them.
What Is HR Analytics?
HR analytics or People Analytics enhances decision-making by leveraging workforce insights. It includes gathering, organizing, and evaluating workforce data to make decisions to improve employee engagement and overall organizational performance.

HR professionals use advanced techniques to identify patterns and trends and offer actionable strategies to improve talent management.
What Is an HR Dashboard?
An HR dashboard basically summarizes and visualizes all the reports, KPIs, and metrics related to Human Resources.
HR dashboards make it easy for HR professionals to analyze, track, and keep a record of metrics for employees and departments. This information helps an organization make data-driven decisions and gather valuable insights.
Why HR Analytics and Dashboards Matter
HR analytics and dashboards are necessary for the following.

- Problem Solving: Through dashboards, you can see visual data about employee turnover, hiring speed, and sentiment. They help you identify issues before they escalate and create more problems.
- Talent Acquisition and Retention: Through analytics, you can track important metrics, such as cost-per-hire and time-to-fill. It helps HR teams identify key recruitment channels and highlight underlying factors to improve retention.
- Strategic Decision-Making: HR analytics are not just for tracking. They help leaders understand trends, such as why turnover happens, and allow them to make decisions based on evidence rather than intuition.
- Workforce Alignment: Using analytics, HR teams can bridge the gap between employee performance and engagement and overall business outcomes, such as productivity and revenue.
- Improved Operational Efficiency: Automating data collection on dashboards saves you time and lets you focus on strategic tasks rather than manual, time-consuming ones.
Core HR Metrics Every Dashboard Should Track
Here are the most important HR metrics your dashboard should track.
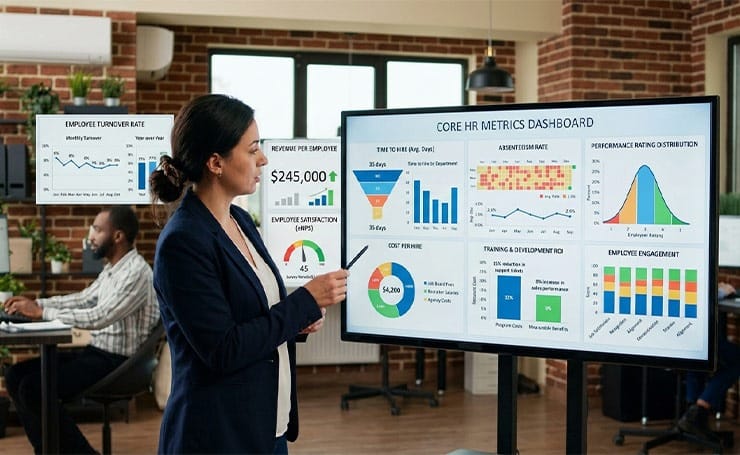
- Employee Turnover Rate: It calculates the percentage of employees who leave your company over a specific time period.
- Revenue Per Employee: This metric divides your organization’s total revenue by the current number of employees, showing your company’s efficiency and productivity.
- Employee Satisfaction: This metric is usually measured through surveys. It shows how likely an employee is to recommend your company as a workplace to others.
- Time to Hire: It shows how long it takes from a candidate’s application to their hiring. It shows how efficient your recruiting process is.
- Cost Per Hire: It calculates the cost of hiring every new employee, including job board fees, agency costs, and recruiter fees.
- Absenteeism Rate: It measures the frequency of an employee’s unscheduled absences due to sickness, personal problems, or other reasons.
- Employee Productivity: This metric measures the workforce’s output relative to input. It varies from industry to industry. HR professionals might track units produced per hour, revenue per employee, or projects completed per quarter.
- Training and Development ROI: This KPI compares the cost of training programs to measurable benefits, such as reduced errors or sales performance.
- Performance Rating: It analyzes how performance ratings are spread across the company. It assesses whether your performance management system identifies high-performing talent and addresses underperformance.
- Employee Engagement: This KPI measures how much your employees are emotionally committed to their work and your organization.
Types of HR Dashboards
Here are some types of HR dashboards.
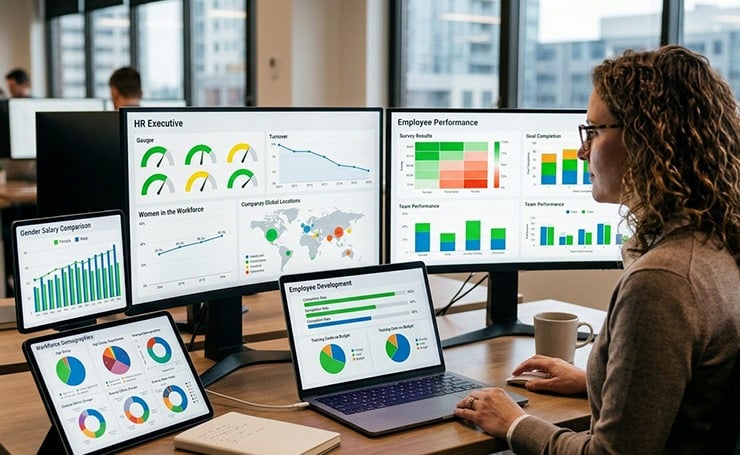
- HR Executive Dashboard: This type of dashboard provides all the critical KPIs in one place for HR executives.
- Employee Performance Dashboard: These dashboards help HR teams and managers to understand the workforce’s satisfaction, effectiveness, and goal progress.
- Employee Development Dashboard: This type of dashboard shows HR leader training program metrics, such as employee completion rates and training costs.
- Workforce Demographics Dashboard: HR professionals try to maintain a diverse workforce. This dashboard allows them to gain insights about age, gender, department, location, and ethnic groups of employees.
- Workforce Diversity Dashboard: This dashboard allows HR executives to dive deeper into demographic data and evaluate one variable, such as ethnic diversity.
- Women in the Workforce Dashboard: This dashboard shows how one particular group is represented in the workforce.
- Gender Salary Comparison Dashboard: These interactive dashboards allow HR professionals to analyze one variable, such as salary comparison by gender.
Workforce Planning Data and Strategic HR
Strategic HR analytics combined with workforce planning ensures that organizations align talent with business goals. They can transform data into actionable insights, like your company can forecast skill gaps and reduce turnover, using this combination.

The dashboards allow HR executives to track key metrics and help them make the right decisions for workforce planning.
Strategic Workforce Planning (SWP) has the following key components.
- Supply Analysis: It reviews current employee skill sets and demographics.
- Demand Analysis: It forecasts future needs based on business strategy.
- Gap Analysis: It identifies inconsistencies between the current talent a company has and its future needs.
- Action Planning: It implements strategies to bridge gaps through hiring, training, or restructuring.
When SWP is analyzed through analytics and dashboards, it provides predictive analysis, data visualization, and scenario planning (what-if) situations to help you improve efficiency and decision-making.
People Analytics Software: Tools and Platforms
Here are some people analytics platforms that offer reporting, engagement, and workforce management.
| Tool | Core Features | Pros | Cons | Best For |
| Visier | Pre-built HR metrics, predictive analytics (attrition, workforce planning), AI insights, benchmarking, data unification | Very deep analytics, strong predictive capabilities, ready-to-use dashboards | Expensive, complex setup, overkill for small teams | Large enterprises with mature data teams |
| Workday People Analytics | Native Workday data insights, dashboards, workforce planning, reporting | Seamless with the Workday ecosystem, good executive reporting | Limited outside Workday, less flexible vs standalone tools | Companies already using Workday HCM |
| Microsoft Viva Glint | Employee surveys, engagement analytics, lifecycle feedback, action recommendations | Excellent for engagement insights, strong UX, and integrates with the Microsoft ecosystem | Not a full analytics suite, limited predictive analytics | Engagement, culture, and employee feedback focus |
| Crunchr | Real-time dashboards, data lake, workforce metrics (turnover, pay equity), reporting automation | Easy to use, fast setup, good visualization | Less advanced predictive analytics than Visier | Mid-sized companies want simpler analytics |
| Rippling | HRIS + payroll + IT + basic analytics, automation, unified employee data | All-in-one system, easy to use, strong integrations | The analytics layer is relatively shallow | SMBs needing HR + analytics in one tool |
HR Dashboard Power BI: A Practical Walkthrough
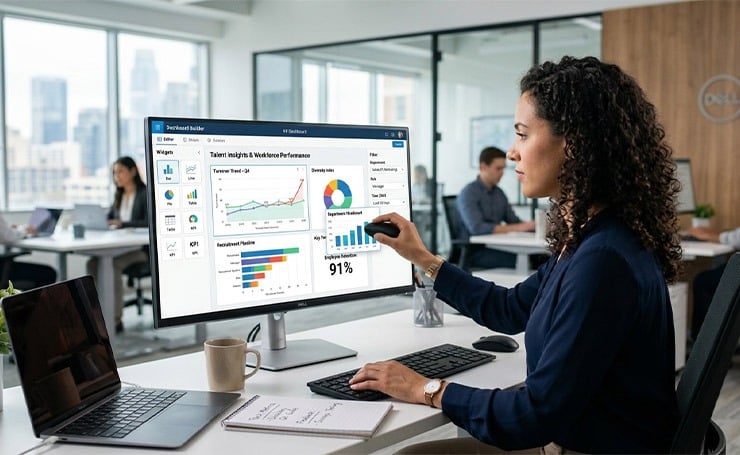
If you have to open 5 different spreadsheets for a simple HR operation, you know how scattered data can slow down everything. One easy solution is an HR dashboard in Microsoft Power BI. It turns raw HR data into clear visual insights you can see and use to make decisions.
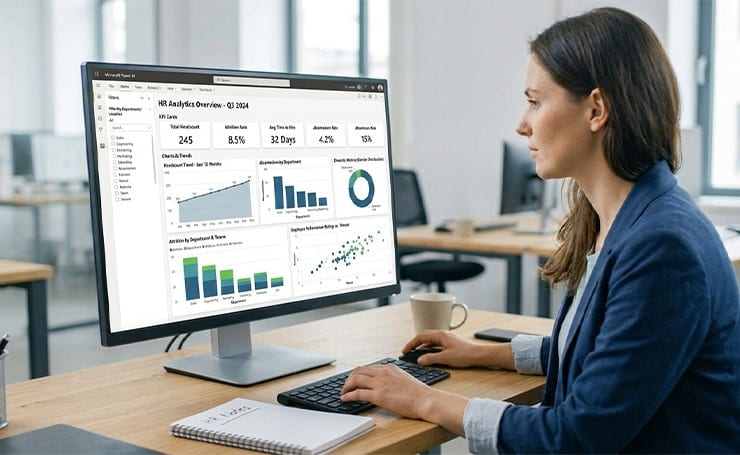
It shows
- Charts
- Trends
- Real-time updates
- Comparisons
To show you core metrics, such as
- Headcount (total employees)
- Attrition rate (which employees are leaving and when)
- Time to hire (hiring efficiency)
- Absenteeism (attendance patterns)
- Employee performance (ratings or KPIs)
- Diversity metrics (gender, department, etc)
How to Build an HR Dashboard in Power BI
Prepare your Data
Gather your data from Excel sheets, payroll or attendance tools, and HRIS systems. Make sure that columns are clean with no duplicates and consistent naming. See whether the dates and numbers are formatted correctly.
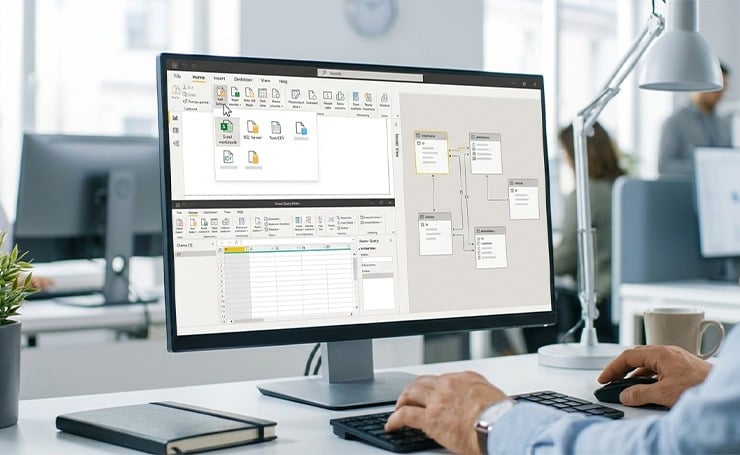
Import Data into Power BI
Take the following steps.
- Open Power BI Desktop.
- Click “Get Data.”
- Upload your dataset.
Once the data is imported, use Power Query to clean and shape it.
Create Relationships (If Using Multiple Tables)
If you have separate tables, such as employees, salaries, and attendance, you can link them all using a common field, like Employee ID. This approach ensures your data works together correctly.
Build Key Visuals
This is the important part. Here, you have to turn data into visuals. Some common visuals include
- Bar charts
- Line charts
- Cards
- Pie charts
Make sure to keep it simple.
Add Filters (Slicers)
Filters make your dashboard more interactive, such as
- Location
- Department
- Time period
This allows managers to explore data without needing new reports.
Design for Readability
A good dashboard is easy to scan in seconds. To make yours scanable, follow these.
- Use consistent colors.
- Avoid cluttering your dashboard.
- Group all related visuals together.
- Highlight all key numbers at the top.
Publish and Share
The last step is to publish your dashboard to the Power BI Service. Share it with your HR teams or leadership. Finally, set up an automatic refresh for real-time updates.
HR KPI Tracking: Best Practices

- Select KPIs that directly support your company’s goals.
- Make sure your KPIs are SMART (Specific, Measurable, Achievable, Relevant, and Time-Bound).
- Visual dashboards are great for easy tracking and trend identification.
- Always review your metrics monthly or quarterly to detect any early warning signs, such as an increasing turnover rate. It helps you identify and solve the problem before it impacts your business.
- Use your KPIs to make the right decisions, such as improving the onboarding process if “new hire turnover” is high.
Building Your First HR Analytics Dashboard: Step by Step
Define Goals
This is one of the most important steps. You need to identify the key workforce questions you want to answer, such as turnover trends, skills gaps, and productivity comparisons.
Select KPIs and Integrate Data
Now, choose KPIs that measure progress and guide your decisions, such as recruitment, retention, engagement, and performance.
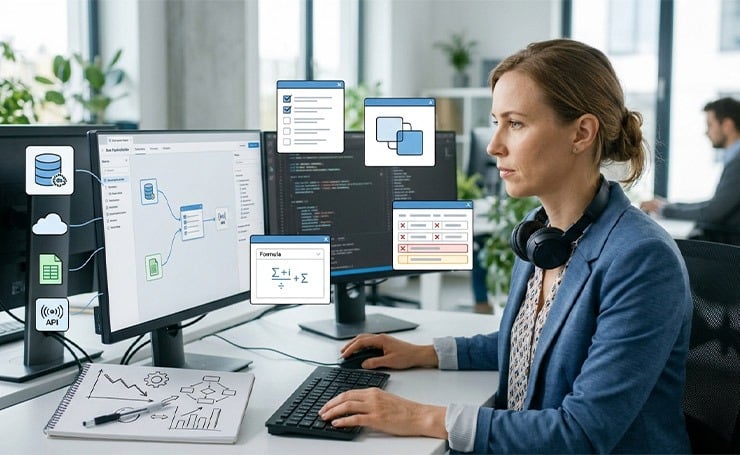
Integrate data from different sources, like cloud warehouse, files, APIs, and databases. Clean and prepare data by
- Selecting relevant fields
- Joining tables
- Adding calculated fields
- Removing duplicates and missing values
Design and Build Dashboard
You can use drag-and-drop tools to create visual dashboards without coding. These dashboards offer several chart types, interactive dashboards, self-service analytics, and real-time filtering.
You can also customize layouts by
- Arranging charts and tables
- Grouping related metrics
- Adding notes or visuals for context
Enable Real-Time Insights
To analyze data, use filters to search for department, role, or time. Real-time dashboards help spot trends, make faster decisions, and plan your workforce.
Test, Launch, and Optimize
After rolling out the dashboard, you can collect feedback using
- User testing
- Surveys
- Task-based testing
You can continuously improve it by analyzing feedback from HR teams, tracking trends, and making iterative updates.
Align with Business Goals
Align all your business priorities with dashboard metrics and track the outcomes.
Wrapping Up
HR analytics and dashboards help an organization track important metrics and gain insights through visualized data. HR executives do not have to switch between multiple Excel files for a simple task because everything is consolidated into one platform, making it easier to track important information.
If you want to learn more about HR SaaS, find comprehensive blogs on the Latest SaaS Updates.
FAQs
What is the Difference Between Workforce Analytics and HR Analytics?
HR analytics is all about employee-related data, such as performance and engagement. On the other hand, workforce analytics is broader, encompassing workforce planning and forecasting, and ensuring alignment with the business.
How often should HR Dashboards be updated?
Most organizations update HR dashboards monthly or quarterly. However, you can track critical metrics like hiring and attrition weekly to make quick decisions.
What are the Biggest Challenges in implementing HR analytics?
Common challenges in implementing HR analytics include poor data quality, unclear goals, low stakeholder adoption, and a lack of system integration.